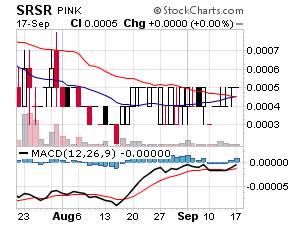
http://stockcharts.com/h-sc/ui?s=RICK&p=D&b=5&g=0&id=p66628098908&a=109628838&am..
GRÖSSE
=inxr, Symbol
uu[h,a] 1580x2188
b,a 180x573
c,a 520x884
d,a 850x659
e,a 780x1084
f,a 1260x1748
g,a 1000x1389
h,a 620x1162
http://stockcharts.com/c-sc/sc?chart=RICK,uu[305,a]dacayaci[pb20!b50][dg][ilA12,26,9]
[305,a]
|
Ghclyiay |
fhclyiay |
ehclyiay |
dhclyiay |
dhcayiay |
whclyiay |
Mhclyiay |
|
15 min |
30 min |
60
min |
Tages Chart |
Tages + Volumen integriert |
Wochen |
Monats |
|
Alle anderen Buchstaben: Keine
Bedeutung |
||||||
|
d5 |
d20 |
|
|
|
|
|
|
|
|
|
|
5 Tage 60 min |
20 Tage 60 min |
|
|
|
|
|
|
|
|
|
|
da
|
Dg |
db |
ab, dl, dn-dz |
|
|
|
|
|
|
|
|
1 Monat |
2 M |
3 M |
7 M |
|
|
|
|
|
|
|
|
dd |
de |
df |
dh |
di |
dj |
dk |
Dm |
|
|
|
|
1 Jahr (J) |
2 J |
3 J |
4 J |
5 J |
7 J |
10 J |
29 J |
|
|
|
|
|
||||||||||
|
|
|
|
|
|
|
|
|
|
|
|
[pb5! a20,2!f] MA5, HL(20,0)
[p bedeutet,
was im Feld des Kurses angezeigt wird. Sozusagen Overlay
… b20,2!f] MA20
…
a20,2!f]
[pc50!c200!f] EMA50,
EMA200
… D20,2!f] BB 20,2
… e20,2!f] ZigZag(20,00%)
…f20,2!f] ---
…f20,2!f] Retrace(20,00%)
…h20,2!f] ---
…i20,2!f] waagrechte Volumenanzeige
…j20,2!f] - …z20,2!f] ---
[vc5!c20] Volumen + MA5 +
MA20
[iut!lv8!lk9!ll5!lah5,15,10!q2,5!lp5,5] Aroon8,
Wm%R9, ADX5,MACD5-15-10, ChiOsc2,5,FullSTO%K(5,3)%D(5)
[iuf!!lk9!ll5!lah5,15,10!uc15!lp5,5] uc15=CMF15
[iut! Obere Anzeige aktuelle
Daten
[iuf! Accum/Dist Tag zuvor + MA20
[j20444984,y]&r=3555
AROON, WILLIAM%R, ADX, RSI, SLOW STOCH, PMO, MACD, ROC,
CCI, ULT, FAST STOCH, PPO
Highlight the brackets, copy, then
paste in a message placing your own symbol where ELX now resides.
Daily
[chart]stockcharts.com/c-sc/sc?chart=pphm,uu[e,a]dhclyiay[db][pb5!d20,2!f][vc5!c20][iut!lv22!lk14!ll14!lb14!lh9,3!lxa!la8,17,9!lm12!ld8!lya7,14,28!LI14,3!LE5,10,15][j20444984,y]&r=3555[/chart]
Weekly
[chart]stockcharts.com/c-sc/sc?chart=pphm,uu[e,a]whclyiay[dd][pb5!d20,2!f][vc5!c20][iut!lv22!lk14!ll14!lb14!lh9,3!lxa!la8,17,9!lm12!ld8!lya7,14,28!LI14,3!LE5,10,15][j20444984,y]&r=3555[/chart]
WHAT TO
LOOK FOR.
MACD- 8,17,9….You watch the fast line cross the slow line and head
towards the mid-zero line.
FAST STOCH- 14,3…You watch the crossover of the %K crosses through the %D
and cross the 20.
ROC- 12….You
watch the ROC coming from –5 to the zero line
PPO- 5,10,15…You watch as the 5 crosses the 10 and races to the
.00
ULT OSC- 7,14,28…You watch as the 30 comes from below and crosses
towards the 50.
PMO- You watch
for the crossover of the PMO through the 10 day EMA.
ADX/DMI- 14…You
watch as the +D line comes from 15 to the 20 and goes up.
AROON- 22…..You
watch as the Aroon up goes up and this can only
happen when the MACD fast & slow cross their mid-zero level.
WILLIAMS%R- 14…You
watch the line cross the 50.
CCI- 8….You
watch the line break the 50.
SLOW STOCH- 9,3…You watch the lines break the 50.
RSI- 14…You
watch the line cross the 50.
And, you watch the 5 day MA cross the 10 day MA.
[da] 1
Monate [db] 3 [ab] 7 [dd] 12
[de] 24
[df] 36
3MD
Add on indicators.
Just separate the indicator by this symbol on your keyboard “!”. This means up above the chart “u”, and this
means below the chart “l”
SETTINGS EXAMPLES
LI14,3 is Fast
Stoch indicator
Lk13
is William%R
indicator
ld5!
Is CCI indicator
[pc13!c30!c50!d20,2!b32!f] is many moving averages embedded in chart
[pc20!c50!d20!f] is 20 day and 50 EMA
]dhcayiay[
is Volume
indicator between brackets
ll14 Is DMI indicator
la12,26,9! Is MACD indicator
ub14 Is RSI indicator
lh14,3 is the indicator for Slow Stoch
[pb20!b50!f] 20 day and 50 day moving average
le5,10,15! Is the PPO indicator
[pb20!b50!g10!f] 20 day and 50 day moving average with a 10
retrace
[vc60]
is EMA of 60 overtop of the volume embedded in the chart.
lp14,3,3 Is the Full Stoch indicator
ut!
Is the closing prices and such
[pd20,2!f] Bollinger
Bands embedded in the chart
lya7,14,28! is ULT indicator
lv22 Is Aroon indicator